
Summary
The Availability dashboard helps you identify and fix availability issues. It lets you dive deep into your product's on-shelf availability and related metrics like waste.
- Quickly see your lowest availability lines, understand the impact on sales, and make targeted interventions.
- View trends over time to detect recurring patterns and tackle ongoing availability challenges.
Setting up the dashboard
The dashboard gives you six configuration options in the top bar, from left to right:
- Select Metric: Select a second metric to view alongside Availability. You can choose between, Gaps, Sales, Waste or Lost Sales.
- Sales, Waste of Lost Sales: Choose to show Sales, Waste and Lost Sales in value or volume terms.
- Start Date: Set the start date for your window.
- End Date: Set the end date for your window.
- Date Range: Choose whether the KPIs and left-hand bar chart should show data from the latest day or an average over your selected date range. The latest day shows by default.
- Time breakdown: Set the time breakdown to view the data by Day, Retailer Week, Calendar Week or Calendar Month.
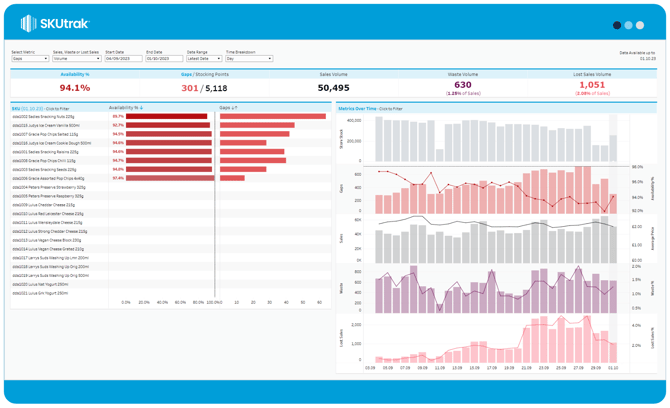
What's on screen
There are three components on-screen, from top to bottom:
- KPI tiles: the KPI summary tiles along the top show you key metrics for the dates and date range you have selected.
- SKU breakdown: on the left side of the page, you will find two bars displaying the Availability percentage and the chosen metric from the settings above.
By considering both sets of bars, you can effectively assess how availability influences your chosen metric.
- Time series: The right side of the page shows 5 sets of time-series graphs for the selected date range, including Store Stock, Availability & Gaps, Sales & Average Price, Waste & Waste percentage, and Lost Sales & Lost Sales percentage.
💡 Stocking points are the total number of SKU / Store combinations
(eg. 10 SKUs in 5 stores = 50 stocking points)
Gaps show the number of unavailable stocking points.