Learn how to use the Compare Time Periods dashboard
The Compare Metrics dashboard is an Essential plan feature.
Summary
The Compare Time Periods dashboard allows you to compare any metric across two different time periods. Select two time periods of any length, with up to 8 metrics, to see how performance varied between them. Use it to:
- Evaluate a promotion by comparing a base period to your promotion period to see the uplift.
- See how your performance is tracking day-by-day in key seasonal periods, such as Christmas or Easter, compared to previous years.

Setting up the dashboard
The dashboard gives you nine configuration options in the top bar, from left to right:
- Product Grouping: change whether the bottom-left bar chart shows Categories, Subcategories, Brands or SKUs. The default setting is SKU.
- Select metric: change the metric shown in the charts on the left-hand side of the screen. The default setting is Sales Value.
- Variance Type: Select the variance, either an absolute value or a percentage. Percentage metrics such as Availability % always use absolute variance.
- Period 1 & 2 Dates - Period 2 is the primary period displayed on the screen, while period 1 is used for comparison.
-
- Period 1 Start Date: Set the start date of Period 1.
- Period 1 End Date: Set the end date of Period 1.
- Period 2 Start Date: Set the start date of Period 2.
- Period 2 End Date: Set the end date of Period 2.
⚠️ Make sure to click the "Apply Dates" button in order for your date selections to take effect.
- Date Comparison: Choose how to compare your selected date periods, the default is Only Dates with Comparison
- Only Dates with Comparison: This will only compare the same number of days in both periods.
- Compare all Dates: this will compare the full date range across both periods, including those with a different number of days
- Select Context Metrics: Select up to 8 metrics to show on the time series.
⚠️ Make sure to click the "Apply" button after selecting your metrics from the drop-down.
What's on screen
There are four types of components on-screen, from top to bottom:
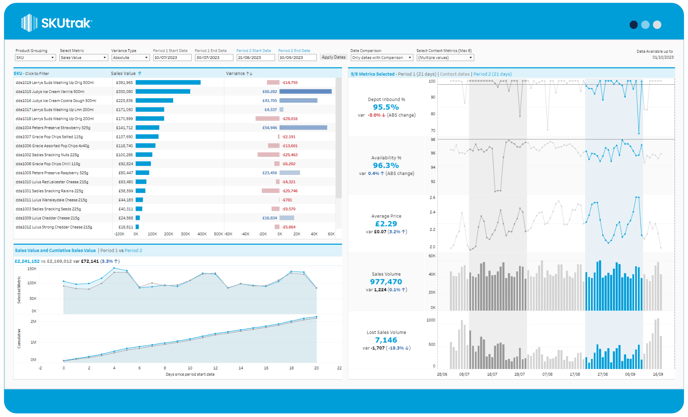
- Product breakdown bar chart: the bar chart in the top left shows the selected metric total for period 2 in the first bar and the variance vs period 1 in the second bar.
- Comparison Time series: Below the Product breakdown bar chart, you will find two time series charts that overlay both time periods. The first chart displays the daily total of your chosen metric, while the second one displays the cumulative total of the selected metric.
- KPI tiles: the KPI summary tiles which run vertically down the page show you the selected context metrics for Period 2 compared with Period 1
- Time series: the full length of the right side of the screen shows your selected context metrics across the full date range; Period 1 Start date - Period 2 End Date. If the the number of days between the end of period 1 and the start of period 2 is more than 28 days, then a maximum of 28 days is displayed in between for context.
Depending on the metric chosen the timeseries will show either a line for percentage metrics and Average Price or bars for all other metrics.
- Dark grey bar or line represents Period 1
- Blue bar or line represents Period 2
- Light grey bar or line represents context dates - 7 days before Period 1 start, any days between Period 1 & 2 and 7 days after Period 2 end
