
Summary
Use the Depot Stock dashboard to understand and act upon your customer's depot stockholding. Identify product/depot combinations which are high or low on stock to inform production forecasts or drive interventions to prevent out-of-stocks.
- View stock levels for each product in each location to see issues which aren't visible at the total level.
- Missed depot-to-store deliveries act as an early warning for availability problems. Spot them early, and make targeted interventions to prevent lost sales.
Setting up the dashboard
The dashboard gives you four configuration options in the top bar, from left to right:
- Product Grouping: change whether the top-left bar chart shows Categories, Subcategories, Brands or individual SKUs. The default setting is SKU.
- Start Date: Set the start date for your time window.
- End Date: Choose the end date for your window. The left-hand bar charts will always show data for the last day in your window (the selected End Date).
- Date Range: Choose whether the KPIs and left-hand bar charts show data from the 'Latest Date' or aggregate over 'All Dates' in your selected date range. The 'Latest Date' shows by default.
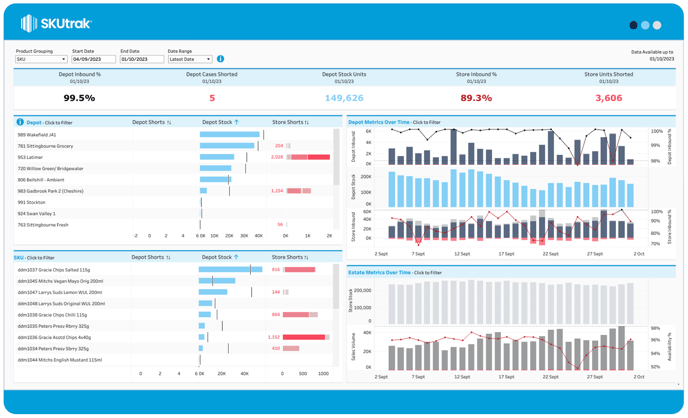
What's on screen
There are three components on-screen, from top to bottom:
- Key Performance Indicator (KPI) Tiles: the KPI summary tiles along the top show you key depot metrics for the dates and date range you have selected.
If you have 'All Dates' selected, Service Levels and Shorts are aggregated across your selected dates whereas Depot Stock is always the latest date (end-date)
💡 For some retailers, the latest date for Depot Inbound and Store Inbound may differ from Depot Stock. This is identified by the date under the KPI title.
- Depot and SKU Breakdowns: On the left, there are two sets of bar charts. They both show; Depot Shorts (missed deliveries into the retailer depots), Depot Stock and Store Shorts (missed deliveries from depots into stores).
Depot Shorts and Store Shorts show either the shorts for 'Latest Date' (end-date) or a sum of shorts for 'All Dates' for the selected dates.
Regardless of the 'Date Range' selected, the Depot Stock bar shows the stock for the most recent date (end-date) and the average stock position over the past 42 days (represented by the black line).
- Depot breakdown bar chart: The top bar shows a breakdown by Depot. In this chart, the Depot Shorts and Store Shorts are shown as a stacked bar made up of SKUs, so you can see which SKUs have contributed to the shorted deliveries.
- SKU breakdown bar chart: The bottom bar shows a breakdown by SKU. In this chart, the Depot Shorts and Store Shorts are shown as a stacked bar made up of depots, so you can see which depots have contributed to the shorted deliveries.
💡 Larger bars represent a higher number of shorts. Hover over the bars to see where else the product or depot is shown.
- Time series: The right side of the page shows Depot Inbound, Depot Stock, Store Inbound, Store Stock, Sales & Availability by day over your selected date window.