Learn how to use the Review Distribution Dashboard
The Review Distribution dashboard is an Essential plan feature.
Summary
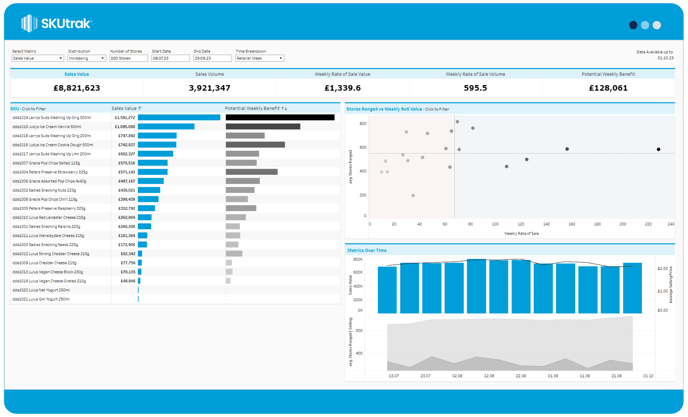
The Review Distribution dashboard helps you create data-led proposals for range reviews. It shows how each product in your portfolio is performing and helps to identify opportunities to increase (or decrease) distribution. Use it to:
-
Quickly see products with a high rate of sale which aren't in all stores, and estimate the sales impact of increased distribution.
- Spot products at risk of being de-listed, and make proactive suggestions to preserve your store presence by replacing them with a higher RoS line.

Setting up the dashboard
The dashboard gives you seven configuration options in the top bar, from left to right:
- Select Metric: Choose between Sales value or Volume on the breakdown, scatter chart and time series.
- Distribution: Choose whether to see the potential impact of increasing or decreasing the number of stores ranging for a product
- Number of Stores: Adjust the number of stores parameter to calculate and visualise the potential benefits or costs of changing store distribution.
- Start Date: Set the start date to view the dashboard.
- End Date: Set the end date to view the dashboard up to.
- Time breakdown: Set the time breakdown to view the data by Retailer Week or Calendar Week. The default is Retailer Week
What's on screen
There are four components on-screen, from top to bottom:
- KPI tile: the KPI summary tiles along the top show the totals for key metrics across the selected date range.
- Product breakdown bar chart: on the left of the screen are two bars. The first bar shows your chosen metric, while the second shows the potential benefit or cost of adjusting store distribution.
- Scatter Chart: in the top right, below the KPI, is a scatter chart showing to relationship between Stores Ranged (Y axis) and Weekly Rate of Sale (X axis)
Spot opportunities to adjust distribution by:-
Increase: Look for products in the bottom right, these products are in a lower number of stores but have a high rate of sale.
- Decrease: Look for products in the top-left, these products have a low rate of sale but are ranged in a high number of stores
-
- Time series: in the bottom right, are two time series charts over the selected date range by week.
- The first shows blue bars representing sales, and a black line to show rate of sale.
- The second time series shows two line/area charts; stores ranged in light grey and stores selling in dark grey.
