
Summary
The Store Availability dashboard alerts you to stores and products suffering from high lost sales caused by out-of-stocks.
- Ensure that your stores are properly stocked and products are on-shelf to avoid unnecessary lost sales.
- Identifying problems in a specific region could be due to disruptions in the supply chain originating from one or a few depots.
Setting up the dashboard
The dashboard gives you one configuration option in the top bar:
-
Select Alert Type: select the type of alerts you'd like on the screen. The default shows both Out of Stock (OOS) and No Sales.
- Select Date: Select a date from the last 30 days to view the alerts. The Default is the latest date.
What's on screen
There are four types of component on-screen, from left to right:
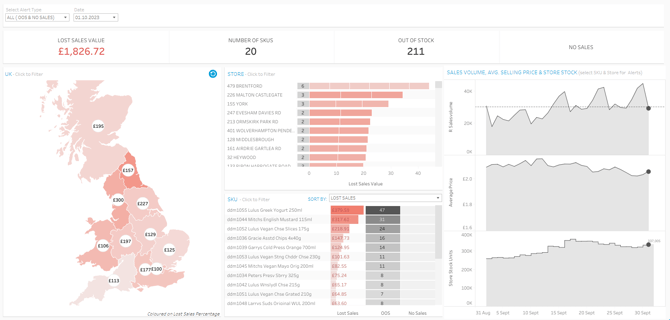
- KPI tiles: the KPI summary tiles along the top show Lost Sales, the number of SKUs with alerts and the split between Out Of Stock and No sales.
- Map: The map is broken down by each region. Lost sales value shows in the circle and the region is coloured in a red scale by the Lost Sales % helping you identify regions with a high proportion of lost sales. Click on the region to filter down to the alerts for Stores and SKU within the region.
💡 To reset the map, click the reset icon in the top right-hand corner of the map.
- Breakdowns: In the middle of the page, you will find two breakdowns.
- The first breakdown at Store level shows you the number of SKUs with an alert in the grey box and the the lost sales attributed to the SKU represented by the red bars.
- The second breakdown at SKU level has three parts. The bar shows the total lost sales for the SKU. The next two numbers in the grey boxes shows the number of out-of-stock or No sales Stores.
- Time series: On the right of the screen three time series charts over the last 30 days show, Sales Volume, Average Price and Store Stock. The dark grey dot indicates the selected date.