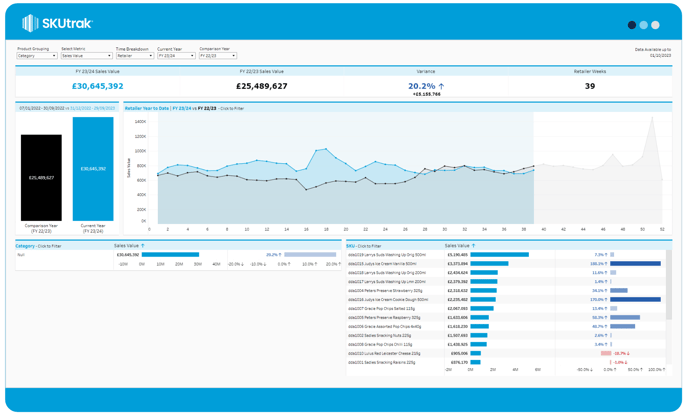
Learn how to use the Year-to-Date Report dashboard
The Year-to-Date Report is an Essential plan feature.
Summary
The Year-to-Date Report makes it easy to track year-on-year performance. See how you're tracking against a comparison year and how different categories and SKUs have contributed. Use it to:
- Track year-on-year performance, from total level down to individual SKU
- Identify category and subcategory trends, and over and under-performing products

Setting up the dashboard
The dashboard gives you five configuration options in the top bar, from left to right:
- Product breakdown: change whether the bottom-left bar chart shows Categories, Subcategories, or Brands. The default setting is Category.
- Select metric: changes the metric shown in all of the charts on-screen. The default setting is Sales Value.
- Calendar: the calendar used to define the year-on-year calculation and time series. The default setting is Retailer Week.
- Comparison year: the year to compare the latest year against. The default setting is FY 22/23.
- Date comparison: If this is set to 'Compare All Dates', all data from the current and comparison year is included. If it is set to 'Only Dates With Comparison', any product/week combinations which do not appear in the current and comparison years will be excluded. This setting can be useful if you want to understand the overall growth of your brand, excluding any delists or NPD. The default setting is 'Compare All Dates'.
What's on screen
There are four types of components on-screen, from top left to bottom right:
- Summary tile: the summary tile in the very top left shows the total for the selected metric over the current period, as well as the total for the comparison period and the variance.
- Total bars: shows the latest year-to-date total in blue and the comparison year's total in grey.
- Time series: the time series shows the selected metric, with the current year in blue and the comparison year in grey.
- Product level and SKU breakdown bar charts: the bottom bar charts show the total for the latest year-to-date in the first bar and the variance from the comparison year in the second bar. The first set of bars shows the selected product breakdown. The second set of bars always shows SKUs.
💡 If you have set the Date Comparison option to 'Only Dates With Comparison', the breakdowns will show a light blue bar in the background to represent the full year to date, including the weeks without a valid comparison. The dark blue bar represents your chosen metric, excluding weeks without comparison.
